Enough flexibility to actually work. Enough rigor to actually last.
The WSU Assessment Suite
Explore a complete evaluation system for the organizational change management program, We See Us.
✅Progress Success Tracker: Compressing the World-Atlas Proportions of WSU into a Scannable Trip Itinerary
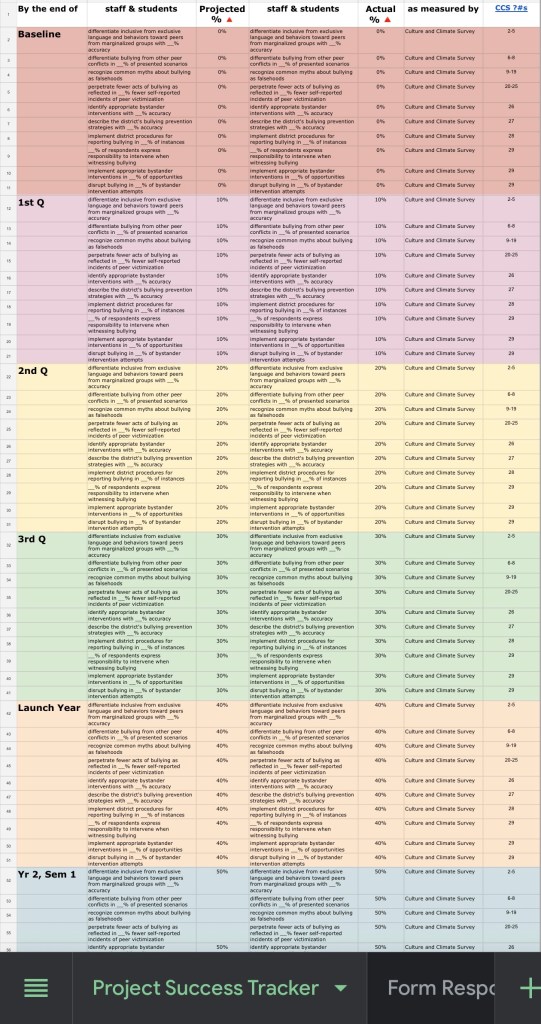
A multi-year organizational change program of this scope has four critical vulnerability windows: before adoption, when decision-makers risk being scared off by the scale; before launch, when implementers risk drifting from the original design intent; during launch, when momentum risks stalling before results are visible; and long-term, when the design choices that guarantee sustainability risk being quietly traded away for convenience. The Project Success Tracker is the zip file — compressing the full arc into a scannable timeline with milestone markers that keeps every stakeholder oriented and accountable at every stage.
📸Culture & Climate Survey: hi-def selfies with #nofilter
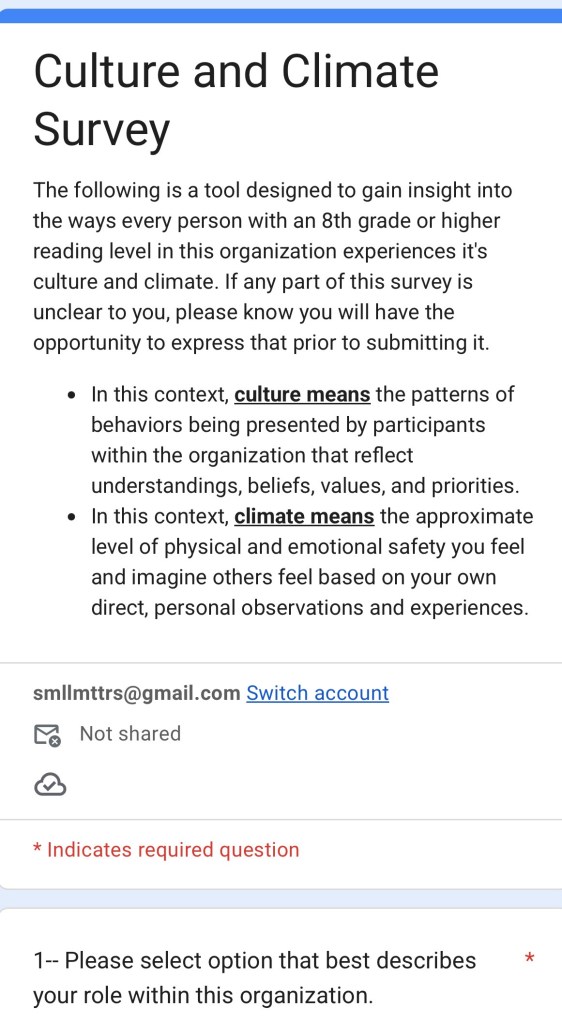
Most culture surveys measure how people feel. This one was designed backward from a different question: what does this instrument need to accomplish before the first session is even delivered? The answer shaped every section — from the self-awareness sequence that primes perspective-taking, to the misconception audit that disrupts the belief systems that protect bullying ecosystems, to the parallel administration that lays the social environment of the organization simultaneously bare to everyone and in front of everyone — including those who’ve most benefited from its previous invisibility. By the time the first learning session begins the Submit button’s hit, change is already catalyzed.
🔄KPI Gap Analysis Matrix: the engine that runs as long as your organization
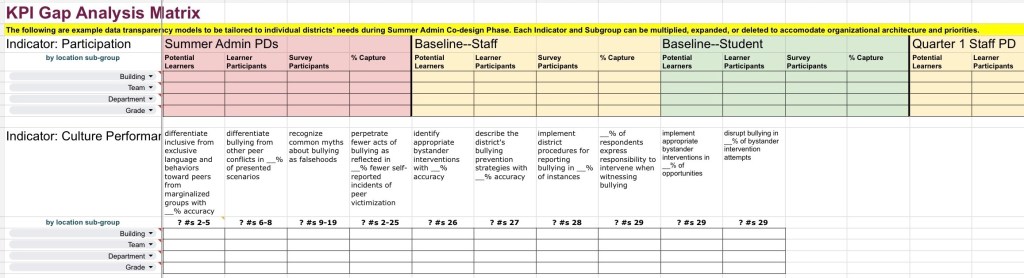
Aggregate data hide places where those most at risk remain unseen. So, I didn’t design a reporting tool. I designed a translation engine. This matrix disaggregates every program indicator by location, role, and grade — mapping directly from survey question to learning objective to behavioral outcome — so that differential impact and the people it represents who may still be waiting for help to come—are visible, addressable, and impossible to average away.
| What was being accepted | Adults selecting, purchasing, and subsequently dragging kids through canned SEL curricula 1 day/wk, 1 month/yr — while modeling racism, sexism, toxic power dynamics, and unchecked bullying directed toward one another and reflected in the systems they designed, year around. No one was measuring for impacts, conveniently hiding that there weren’t any. Worse, no one questioned the assumption that kids were the ones in need of fixing since, surely, they’d learned their behaviors in a bubble despite all modern research about the innate nature of bias or the social nature of learning. |
| What I saw instead | The root was never the kids — it was a community-wide deficit in self- and other-awareness, ignorance about identity, what counts as bullying, and what boundaries are. And every initiative I’d ever been inside died at one of four predictable points: before adoption, when decision-makers get scared off by scale; before launch, when implementers drift from design intent; during launch, when momentum stalls before results are visible; and long-term, when the choices that guarantee sustainability get quietly traded away for convenience. |
| What I built with what was already there | Three interdependent tools in Google Sheets. A Culture & Climate Survey designed backward from what it needs to accomplish before the first session even launches — priming self-awareness, surfacing misconceptions, and laying the organization’s social environment bare. A KPI Gap Analysis Matrix that disaggregates every program indicator by location, role, and grade so differential impact can’t be averaged away. A Progress Tracker that compresses thousands of learners, hundreds of design decisions, and thirty months into a scannable timeline with milestone markers that keep every stakeholder oriented and accountable. |
| What can’t go back to broken | The system is structural, not programmatic. The KPI matrix runs as long as the organization runs — each cycle’s data becomes the next cycle’s baseline. The survey catalyzes change before instruction begins. The tracker makes drift visible before it compounds. Remove any one component and the system loses its diagnostic capability. |
| What gets impacted | Every person in the organization — staff, students, families — and every person drawn into proximity through community SME partnerships. The survey reaches anyone with an 8th grade reading level, the KPI matrix disaggregates by every location, role, and grade level, and the progress tracker spans the full implementation arc from baseline through year two and beyond. The system is designed to run indefinitely — each cycle generates the data that drives the next — so impact compounds whether or not the designer is still in the room. |
